

Last week Part 1 of the Predicting Contact Center Average Handle Time blog series discussed real-world examples and how to build a histogram to extract useful information for your contact center. In Part 2 we will dive into some of the more advanced approaches to predicting average handle time.
From Histogram to Probability Density Function
Based on the histogram, we could create a probability density function (PDF) that will help us with more accurate reasoning about handle times. The PDF could be easily obtained from a histogram through its normalization – by dividing each bar of the histogram by the total number of calls. In our case, we will divide the bars by 1000 and obtain the graph shown in Figure 3 below.
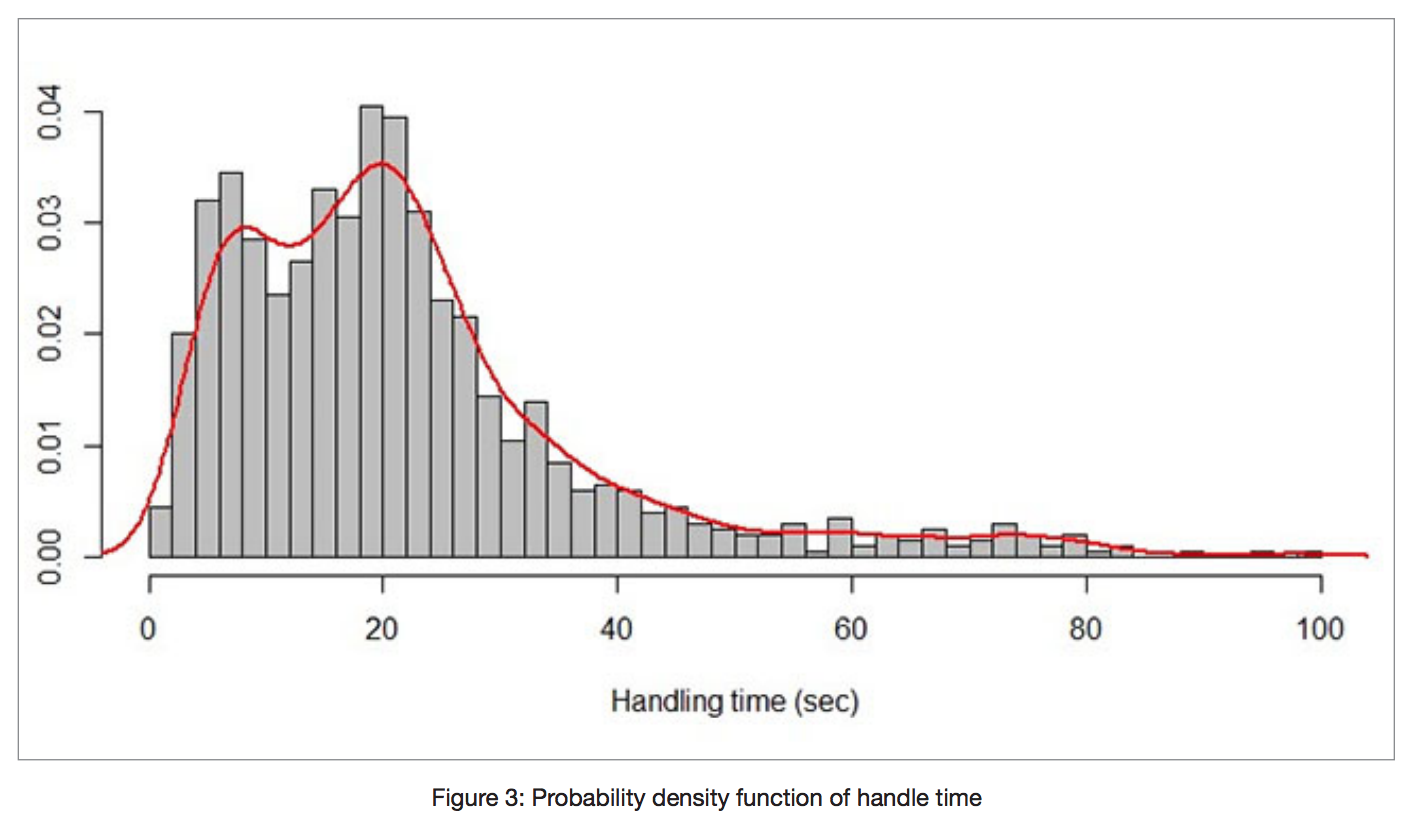
Now, after normalization, the total sum of all bars will be equal to 1.
It is interesting to pay attention to the shape of the function. If we approximate the shape of the histogram by using an approximate smooth curve in red, we could not determine any known distribution. We can see it is definitely neither normal distribution nor an exponential one.
Moreover, it is not close to any known analytical distribution function we are aware of. Therefore, it is more convenient to treat this distribution as a discrete empirical distribution – a distribution function that is described as it is. The discrete empirical distribution could be easily specified as an array of numbers where the size of the array depends on precision.
With the creation of a probability density function, we could answer questions such as, “What would happen with the agent at some moment of time?” For instance, the next example, Figure 4, enables us to predict what will happen 30 seconds after the handling of a call begins.
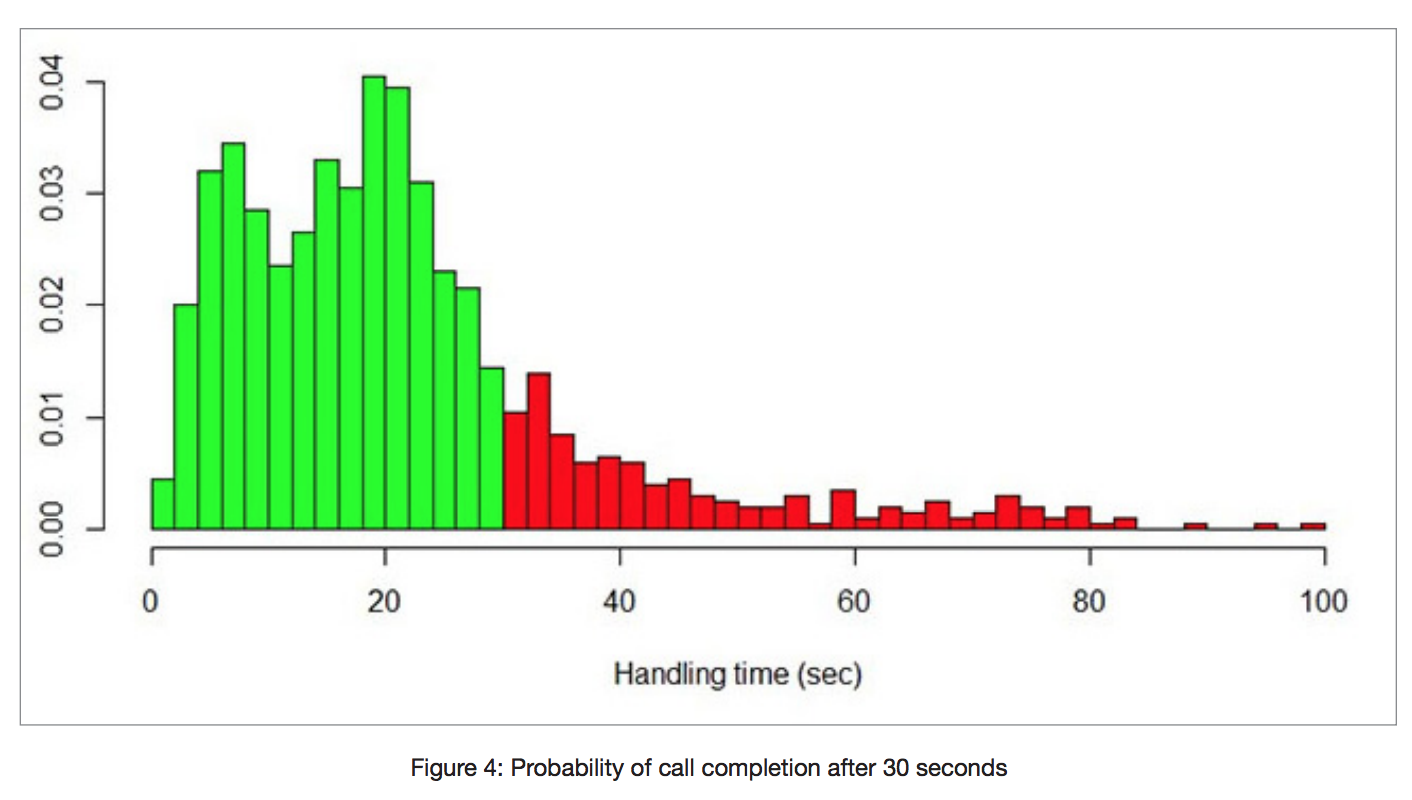
We paint the probability graph in green when handle time duration is less than 30 seconds and in red for calls of a longer duration. The probability of handle time completion in 30 seconds is equal to a square of the green part of the plot. Correspondingly, the probability of non-completion is equal to the red area. If we calculate these numbers, we obtain probabilities equal to 0.8 and 0.2, respectively. This means that the probability of the agent completing the call within 30 seconds is 0.8.
Sometimes it is more convenient to represent probability as a percentage. Thus our 0.8 probability could be referred to as 80%.
It should be noted that the calculations are not complicated and consist in summing the elements of the subarray. However, when we try to answer the question “When will call handling be completed with 90% probability?” the calculations will be more complicated. To answer this and similar questions, we suggest using the cumulative distribution function (CDF).
From PDF to CDF
Let us build a cumulative distribution function from the PDF using the following simple procedure. The value of CDF at some point is calculated as the sum of all PDF values before this point. Therefore the value of the CDF at a specific moment in time will represent the probability of completing call handling by this time.
The graphical representation of the CDF of our handle time is represented in Figure 5 below.
It is important that the CDF can be easily calculated from the PDF. The value of CDF at some point is equal to the sum of the PDF bars from the left area of the graph. Consequently, if we have empirical discrete PDF of some random value, we could easily create a CDF for this value.
Let us now show how to use CDF. Suppose we could calculate a probability of call handling completion in 30 seconds. The probability will be equal to the value of the function at point 30 (see red dashed lines). So we do not even need to sum the values of the bars up as required for the PDF.
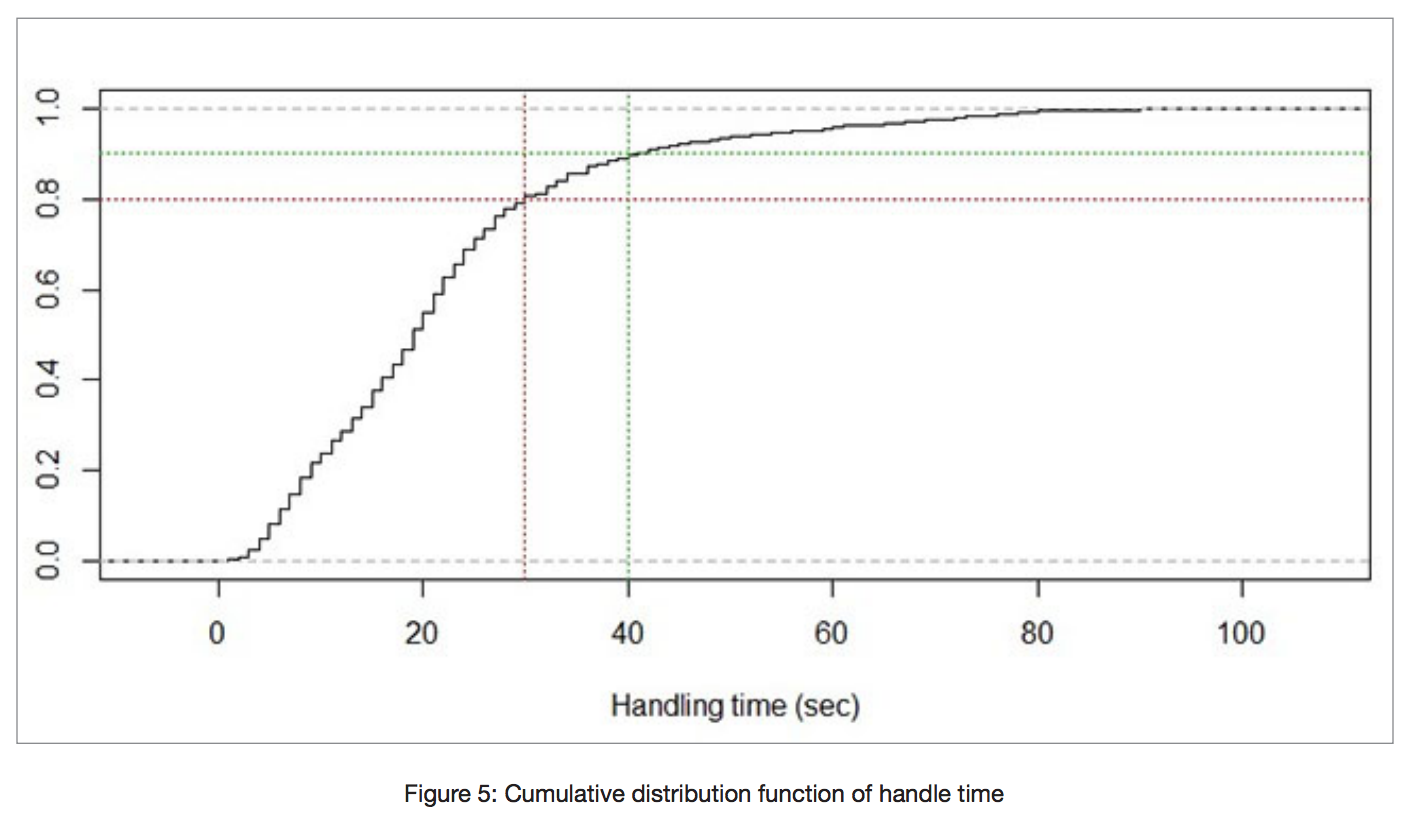
Suppose now that we want to ask an alternative question: “When will the call be completed with a probability of 90%?” To answer this question we draw a horizontal line (see the green dashed line above in Figure 5) at a value of 0.9, and we immediately obtain the answer of 40 seconds.
Using Conditional Probability
CDF and PDF allow for the answering of even more complicated questions about agent statuses. Suppose we have an agent who has already been engaged on a call for 20 seconds. We wonder what will happen with the agent and the call on the 30th second (counting from the beginning of call handling). More specifically, we want to know the probability of completion of this call within the next 10 seconds. To answer this and similar questions, we should use the notion of conditional probability.
We will explain this notion by using the PDF of our example, represented in Figure 6 below.
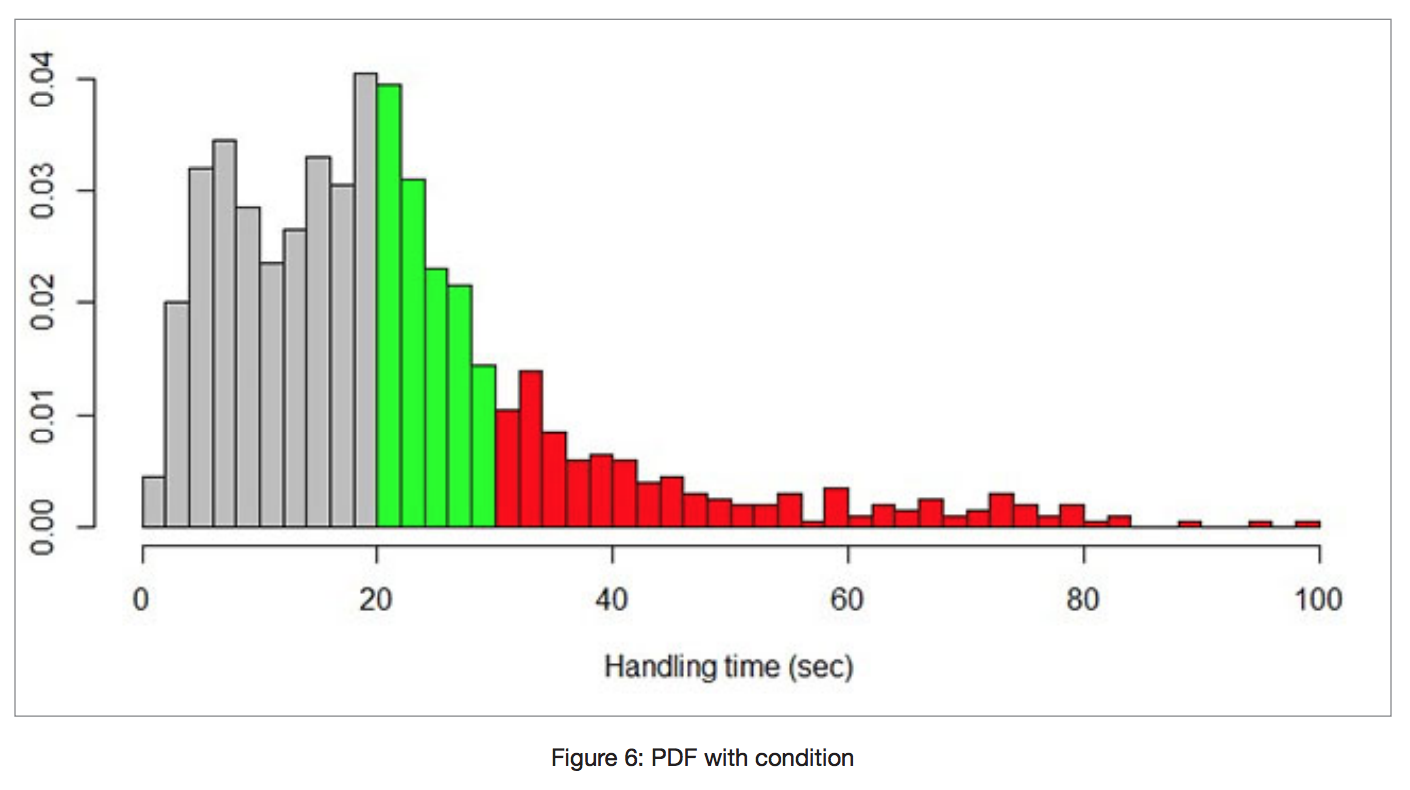
Because the agent has worked on the call for 20 seconds, we have colored the area prior to this moment in gray, indicating that this part does not interest us. Let us take only the right part of the function and normalize it to make its area equal to 1. The resulting new PDF is shown in Figure 7 below.
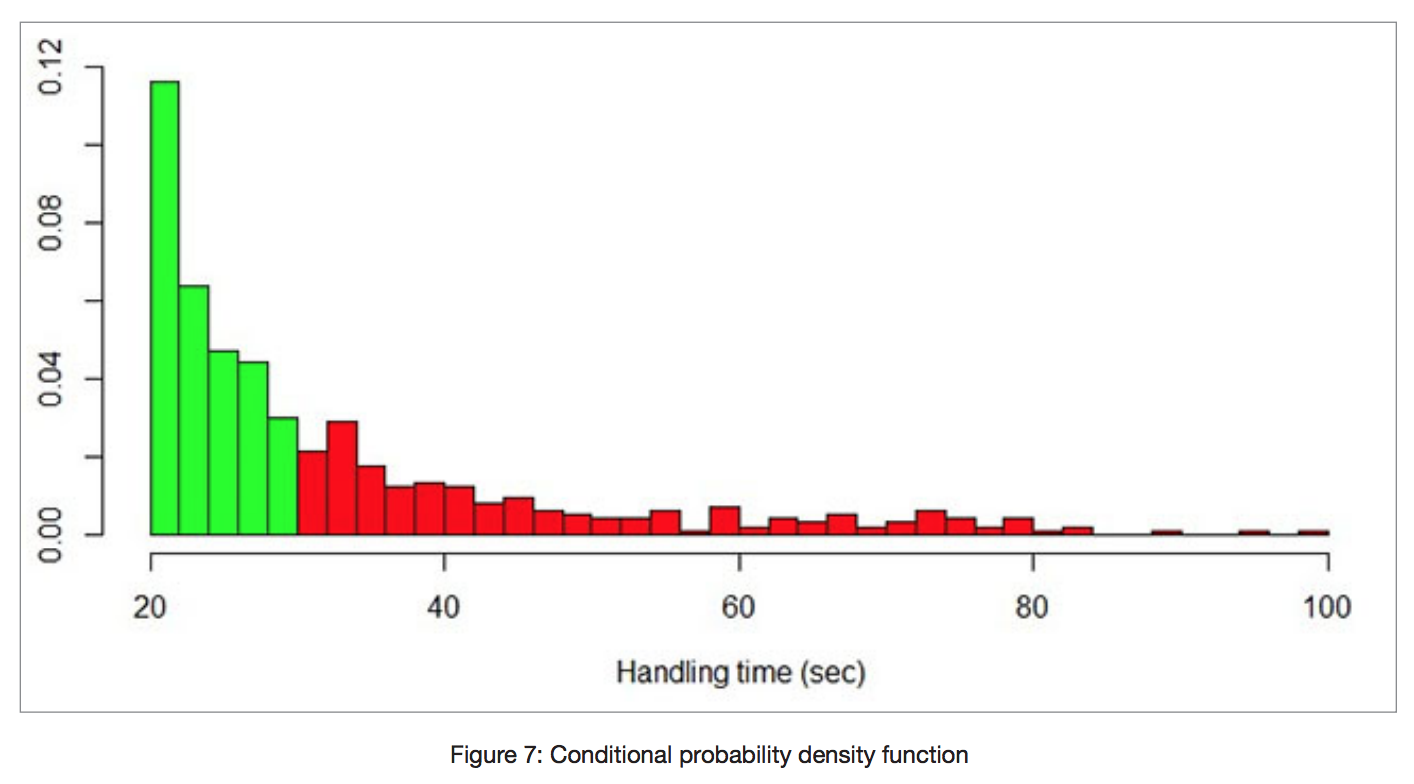
Now we start using the new PDF as our working PDF and can estimate the future of the agent. For instance, we could calculate the probability of completing the call handling within 10 seconds (see the green area of the plot). The calculations will give us 60% probability. That means the agent, who has already spent 20 seconds on the call, will complete the call handling within 10 seconds with the probability of 60%.
Download our e-book on Predicting Average Handle Time for more information!