

Average handle time, or AHT, is one of the most important contact center metrics. It characterizes the duration of call processing by agents and has a strong impact on the whole operation of the contact center. For instance, it directly influences waiting time, abandonment rate, occupancy of agents, workforce demand, and ultimately both customer satisfaction and cost of operation.
At the same time, AHT is a rough characteristic of the handle time that provides only limited understanding about its nature and ways to use it. In reality, handle time is a random value that varies from case to case and deserves a more accurate consideration. Looking at handle time, we need to be able to predict agents’ status. For example, we should be able to estimate an engaged agents’ chances of becoming available again after a specific period of time.
It would be nice if the handle time were a constant value because it would simplify everything. Imagine that all handle time values are the same and are equal to, say, 180 seconds. This means that when an agent starts talking to a customer they will definitely complete the call in 180 seconds. We could predict the behavior of the agent very precisely.
Unfortunately, this is not the case in practice. The handle time is a random value and needs to be treated as such. In this article we make an attempt to consider the handle time as a speculative value and apply a statistical approach to its treatment.
Real-World Example
Normally the handle time includes the talk time, times when the call is on hold, and after call work time – all periods when the agent is considered to be busy and no call is distributed to them.
It is clear that taking a single measurement of handle time is completely useless. Indeed, it will tell us nothing, because all subsequent measurements will be different. Instead of one measurement, we could take a series of measurements. Intuitively, it is clear that the more measurements we make the better the precision will be. The problem now is how to use this gathered information.
Let us take handle time samples recorded from a real-world outbound campaign. The campaign was running in the Bright Pattern Cloud Contact Center to support a political election campaign. We collected one thousand samples, measured in seconds:
1, 61, 30, 19, 15, 4, 12, 24, 29, 33, 21, 24, 10, 20, 25, 8, 51, 4, 49, 23, 23, 10, 19, 36, 2, 4, 20, 98, 9, 79, 9, 63, 26, 13, 5, 27, 20, …….., 18, 8, 65, 6, 19, 21
What could be done with these numbers? First of all, we could determine a minimum and maximum times in seconds – 1 and 98, respectively. Moreover, we could calculate a mean value that happens to be equal to 22.04 seconds. However, this value is nothing more than the familiar average handle time (AHT). This value tells us something, but it does not tell us enough.
For instance, we are still not able to answer the main questions related to future agent status. To help us with gaining an understanding, let us try to visualize the information we have. We could show the individual call times in a bar graph where we can provide a visual indication of how handle times vary. The graph is depicted in Figure 1 below.
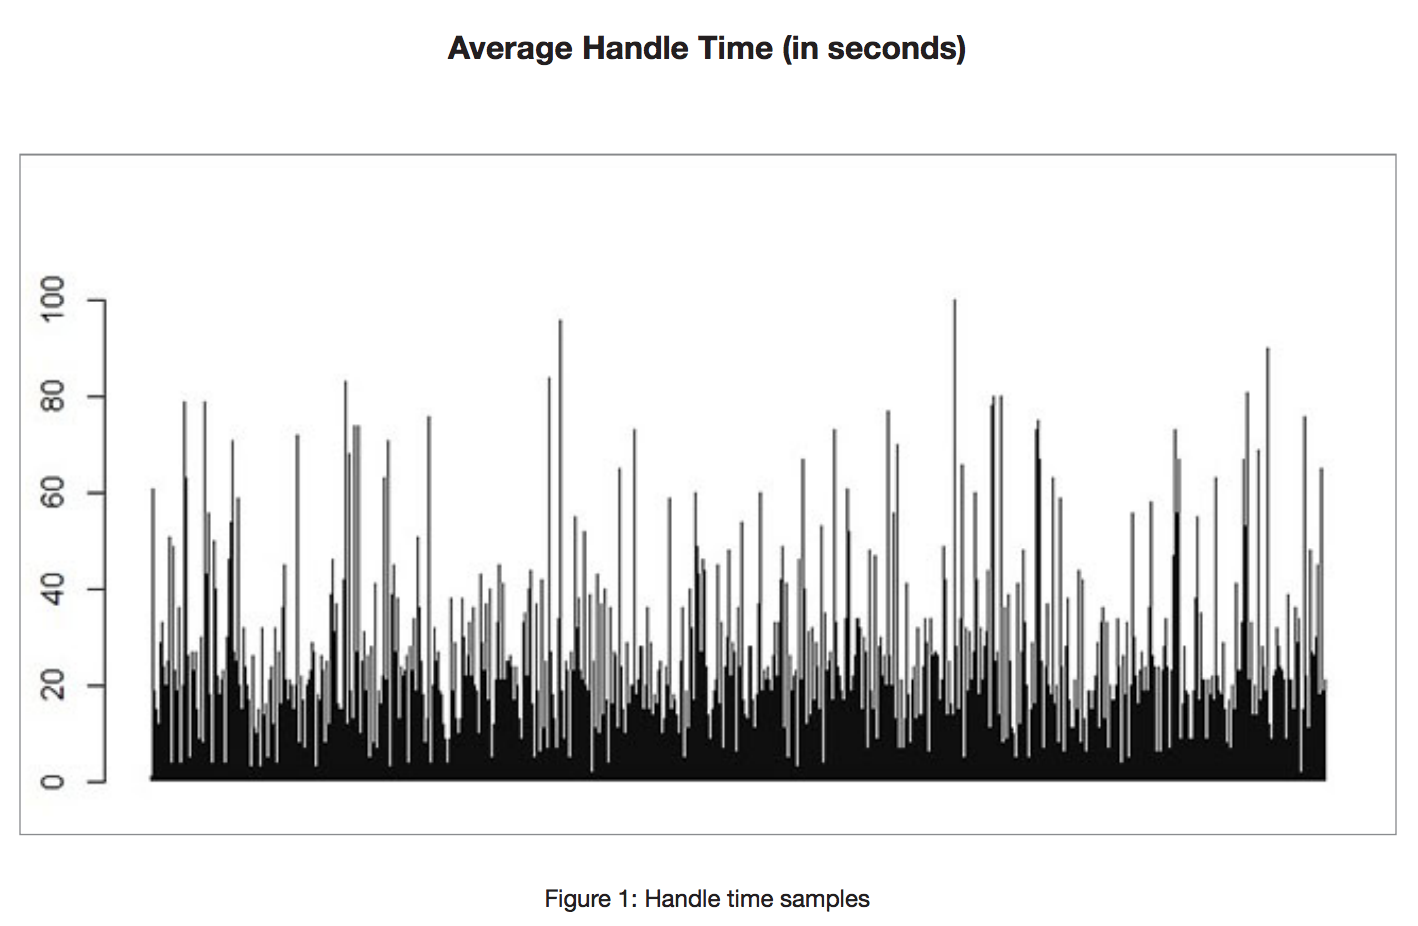
What useful information can be extracted from the graph? Not a lot, but something can. First, handle times can vary from a few seconds to minutes. Second, there are more short calls than long ones. And that is it!
Building a Histogram
To extract more useful information from the samples, let us group the handle times together by building a histogram. To accomplish this, we divide all times into, say, 50 intervals ranging from 0 to 100 and calculate the number of calls in each interval. Graphically, each interval will be depicted as a bar where its height corresponds to the number of calls that happen to fit in the interval. As a result, we obtain a histogram – a bar graph shown in Figure 2.
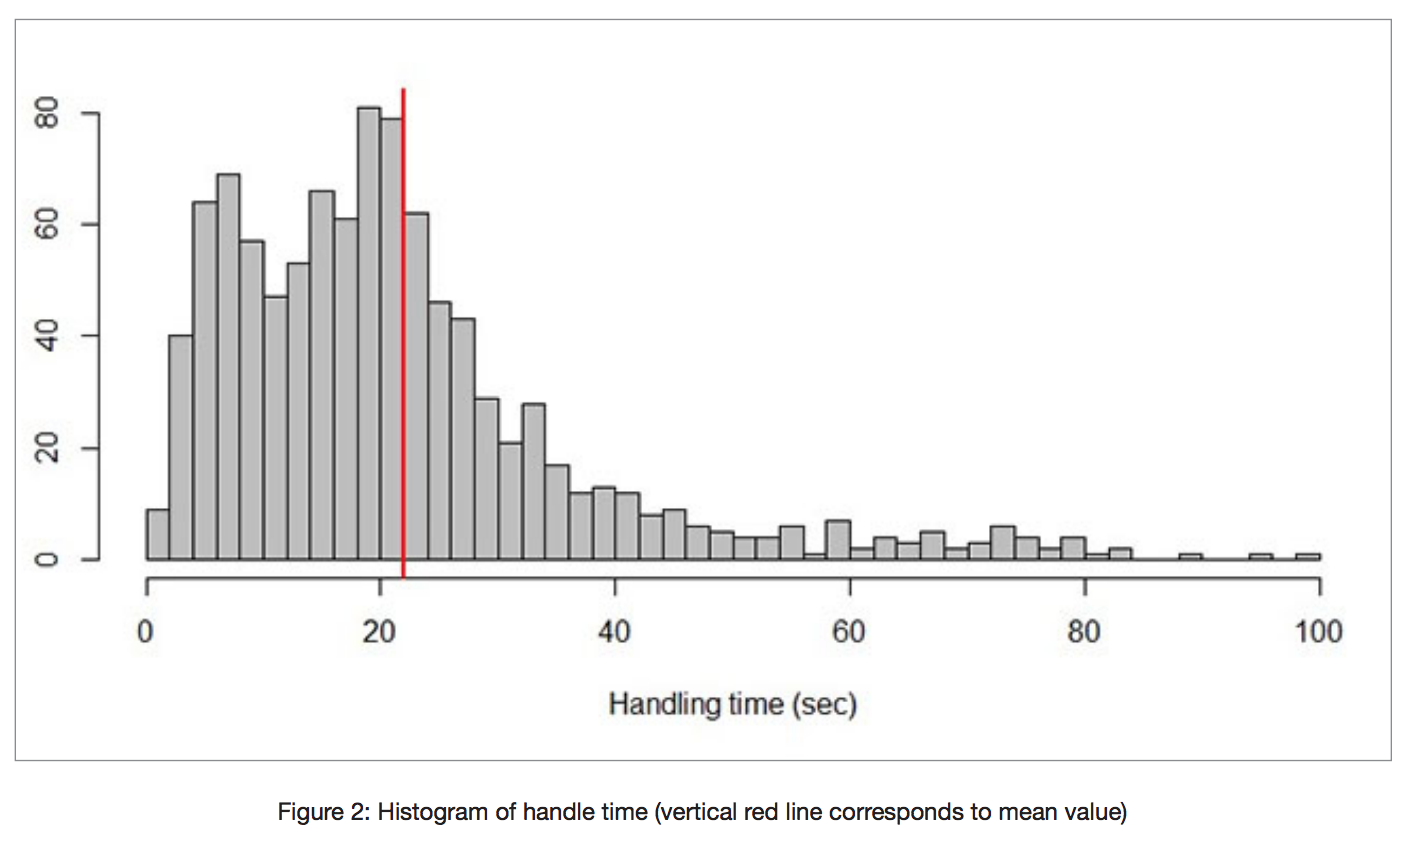
What useful information can the histogram provide us with? The histogram tells us about the frequency of handle times for each time interval. For instance, we could see that the interval between 18 and 20 seconds contains most calls. At the same time, there are instances where for some of the longer durations, no calls were registered.
The duration of most calls falls between 2 and 30 seconds. After 40 seconds the number of calls decreases sharply and tends to zero.
The histogram certainly improves our understanding of the nature of the handle times, but it still does not give us a precise tool to reason and predict agent behavior.
Download our e-book on Predicting Average Handle Time for more advanced approaches!