Contact center Key Performance Indicator (KPIs) are used by SMB and enterprise companies to make better business decisions and improve the customer experience. Also called metrics, KPIs are the measurable values that show just how effective your business is at achieving its goals.
In our last blog, we touched upon the top agent KPIs that your contact center should be tracking. We covered the real-time metrics that supervisors use on a daily basis to monitor the status and productivity of their agents.
This time, we’ll dive into team metrics, which, while similar to agent metrics, focus specifically on the performance of the team you supervise. Team metrics show the sum or average of all values pulled from individual agents within a given team.
Team Players
To be an effective team leader, you have to know what your team is doing. You also have to be able to monitor your agents without being too creepy about it.
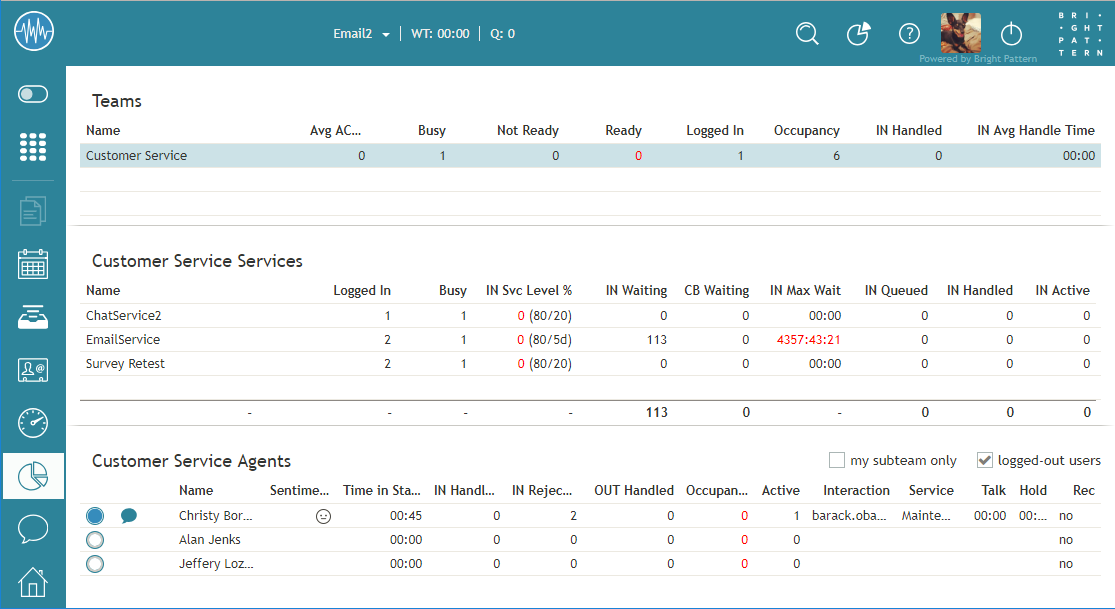
Fortunately, real-time dashboards and wallboards give supervisors a broad view of:
- Agent states: What is my team doing right now?
- Time: How much time has been used or wasted?
- Inbound: How many inbound calls have been handled by my team today?
- Outbound: How many outbound calls and emails have been sent today?

Agent States
Agent states show the current status of logged-in agents. The ones to watch are:
- Ready
- Busy
- Not Ready
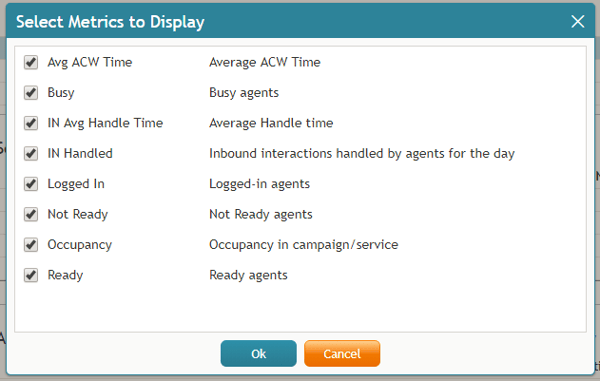
Agents that are Ready are available to handle incoming interactions, agents that are Busy are already handling an interaction, and agents that are Not Ready are unable to accept an interaction for some reason (e.g., lunch, break, meeting, etc.).
These metrics may seem basic, but they provide a quick overview of your team’s ability to accept calls and chats. An abundance of ready agents may prompt you to check the status of the queue (“There are 15 calls in the queue. Why aren’t agents taking them?”) and their services (“Agents are available…. Are my services running?”).
Time
It’s important to keep an eye on just how productive your team is, and you can do that by monitoring the duration of their activities. The following metrics are especially useful.
Average ACW Time is the average daily time agents spend handling after-call work (ACW). ACW includes all the tasks that must be done before agents can move on to another interaction (e.g., set dispositions, take notes, schedule follow-ups, etc.).
Average Idle Time is the average time that agents have spent in the Ready state in between handling service interactions. When this metric is high, you know that your team is waiting, waiting, waiting for something to do. If this is the case, you could be increasing your agents’ capacity to handle other types of interactions, such as chats and emails, while they are waiting for a call.
Average Handle Time is the average time, including hold time and after-call-work time, that the agent has answered and handled calls to the service. When this metric is high, you may want to check out the individual interaction records to find out why the calls are taking so long and what you can do to help.
Occupancy is the average percentage of time agents that have spent handling interactions of the given service (including the preview time and after-call work) out of their total working time (i.e., the time the agents have spent handling interactions of any service and being Ready to handle interactions). Occupancy, at the group level, provides a snapshot of your team’s productivity.

Inbound
Inbound Interactions Handled is the number of inbound interactions that agents on your team have handled and completed for the day. A spike in inbound calls might signal a problem with product or service, for example.
Outbound
Outbound Interactions Handled is the number of outbound interactions being handled and completed by agents, including non-replies via email. If your team has a high average idle time, you could assign more outbound interactions to fill in their time.
Outbound Calls Rejected is the number of outbound calls that have been either rejected or unanswered by agents. When your team isn’t accepting calls, you have to ask yourself, are agents too busy?
A Contact Center Driven by Insights
Team metrics provide detailed information about agent performance, service quality, and customer satisfaction. These KPIs provide the insights you need for improving agent engagement and elevating the customer experience.
The customer experience hinges on empowering agents with the right training, tools, and service model. Bright Pattern’s omnichannel contact center software helps empower agents with unique tools that facilitate better conversations, boost agent performance, and deliver higher returns in customer satisfaction and agent engagement. Having a unified and powerful agent desktop that displays important KPIs helps to keep supervisors focused on teams and agents focused on customers.
You can learn more about how monitoring agent metrics can help improve agent engagement and customer service by downloading our e-book.

