
Selecting an acceptable service level threshold and average speed of answer target has always seemed an inexact science to me. Where should the numbers come from? Why must the calls be answered in 20 seconds?
There is an excellent past webinar from MetricNet: “Unleashing the Enormous Power of Service Desk KPIs” with tons of applicable advice (not only to helpdesks). The relevant piece about a correlation of acceptable abandonment time and call duration comes at 57:11. MetricNet states, based on the call center metric field data they collected, that waiting for 10% of average call length is acceptable and does not impact customer satisfaction.
I decided to look at our customers’ historical data that we routinely review for QBR purposes.
We provide a per-call post-transaction survey (1st call + agent perf + NPS) module as part of our standard offering, but post-transaction samples are heavily skewed towards unhappy clients of our customers. For the kind of research I was after, a wider set of satisfaction data is needed, one that was indexed at CRM level, I believe.
Instead, I tried to run some correlation of abandonment time and call duration. Granted, in many cases, customers are willing to wait much longer than call duration, and we also should not discount that the call duration we are talking here is as perceived by a caller, not the actual.
With that disclaimer, let me speculate on some anonymous data:
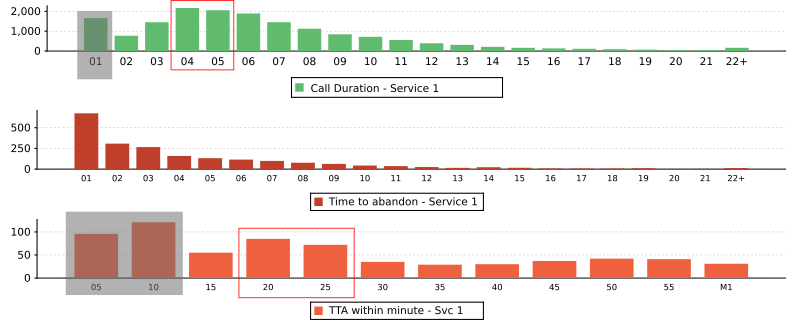
Service 1: the per-minute abandonment chart shows that most abandons happen within the first minute, so let’s focus on that minute with 5-sec resolution:
Looks like there certainly is some correlation, after we discount short calls and short abandons, most abandons happen at ~ 8% of the discrete mode of talk time. (I think discrete mode is more appropriate in this case than average).
Answering before 20 seconds would take care of most abandonments, in this case, keeping abandonment rate (that is a bit on a high side at 11.4%) in a nice shape.
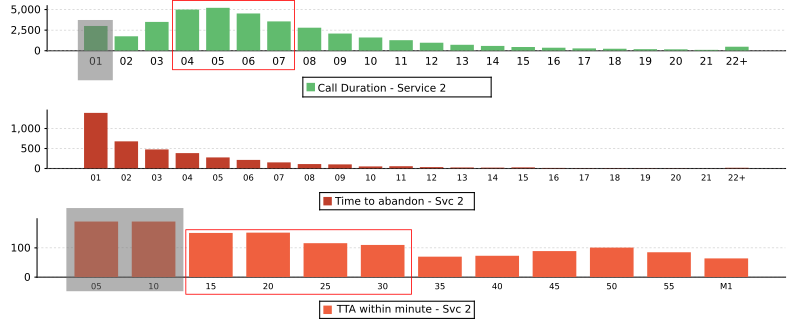
Let’s look at another service - again, most abandons happen within the first minute.
It seems that the abandonment peak is at 6.25% of talk time, but because we don’t have a nice abandonment peak here, we cannot really be sure.
The sample size is definitely larger, while the share of abandoned calls seems to be much smaller - perhaps the abandonment problem is addressed (abandoned calls are at 9.5%) and we simply don’t see the issue that could be?
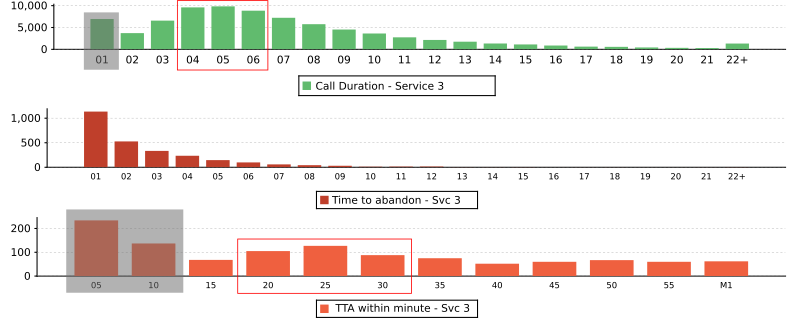
Service 3: Again, most abandons happen within the first minute, let’s focus on that minute: like in the first case, abandons are grouped at 8% of the discrete mode of talk time again. The service here is at 3.2% overall abandonment rate which is very good.
What do you think? How do you set your Service Level/Average Speed of Answer targets?
(for our customers: analysis reports I used in this article)
UPD - not median but discrete mode, of course!